Jakmall
Designing An Affiliate Dashboard
Timeline
Jan 2022
MY ROLE
Full-Stack Designer
Responsibilities
Product Design
Product Thinking
UX Research
Company
Jakmall
Tools
Figma
Figjam
Jira
Background
Jakmall's affiliate users who don't have a dashboard face several problems. The lack of a dashboard makes it difficult for them to track their affiliate earnings, referral activities, and other important metrics related to their performance as an affiliate. Without a dashboard, affiliates may not have access to real-time data, making it difficult to make informed decisions about their promotional activities.
The Problem
Affiliate partners lacked a centralized platform to manage their accounts, track performance metrics, and access earnings data efficiently. The absence of a cohesive dashboard led to:
Difficulty understanding program performance.
Inefficient communication with the affiliate team.
Time-consuming manual reporting processes.
Our Stakeholders
Performance metrics and graphics: Charts that show affiliate’s store perfomance
Revenue Summary: Shows total revenue by day, weeks, and month, and
Order/ Transaction Summary: Display ongoing transaction data; waiting for payment, being processed, delivery, and complaints.
Filter: User can filter the store and dates
Top-Selling Products: Display the best-selling products by the numbers of unit sold.
Research
Gathering Insights
User Interview
The next step is to validate our assumptions, scopes or prove them wrong, with research. we conducted an estimated 40 minutes the qualitative research by interviewing 6 affiliates user via Google Meet. We try to understand their needs and pain points.
Related Topics:
What is a must have features in a dashboard?
How’s your experience in using the current checkout system?
Do you have any difficulties in the checkout process?
Benchmarking
I conduct benchmarking process to help me analyze and understand the use cases, be familiar with the design patterns and get inspirations for the design, and discover the current industry standards for an affiliate marketplace dashboard.
How do the products onboard new user
How do the products visualize data
How does the information architecture look like?
How do the products empower users to spot the info they’re looking for?
Solutions
Sales Summary
The revenue summary feature of the affiliate dashboard provides an overview of the affiliate's earnings over a period of time. This feature displays the total revenue earned by the affiliate on a daily, weekly, and monthly basis. It allows affiliates to track their earnings easily and make informed decisions about their promotional activities.
Transaction Summary (Ringkasan Transaksi)
The revenue summary feature of the affiliate dashboard provides an overview of the affiliate's earnings over a period of time. This feature displays the total revenue earned by the affiliate on a daily, weekly, and monthly basis. It allows affiliates to track their earnings easily and make informed decisions about their promotional activities.
Changes Log (Log Perubahan)
This feature shows changes in product details details changes such as price, product stock, descriptions, etc.
Performance Graphics (Trend Pembelian)
This feature shows changes in product details details changes such as price, product stock, descriptions, etc.
Order (Pesanan)
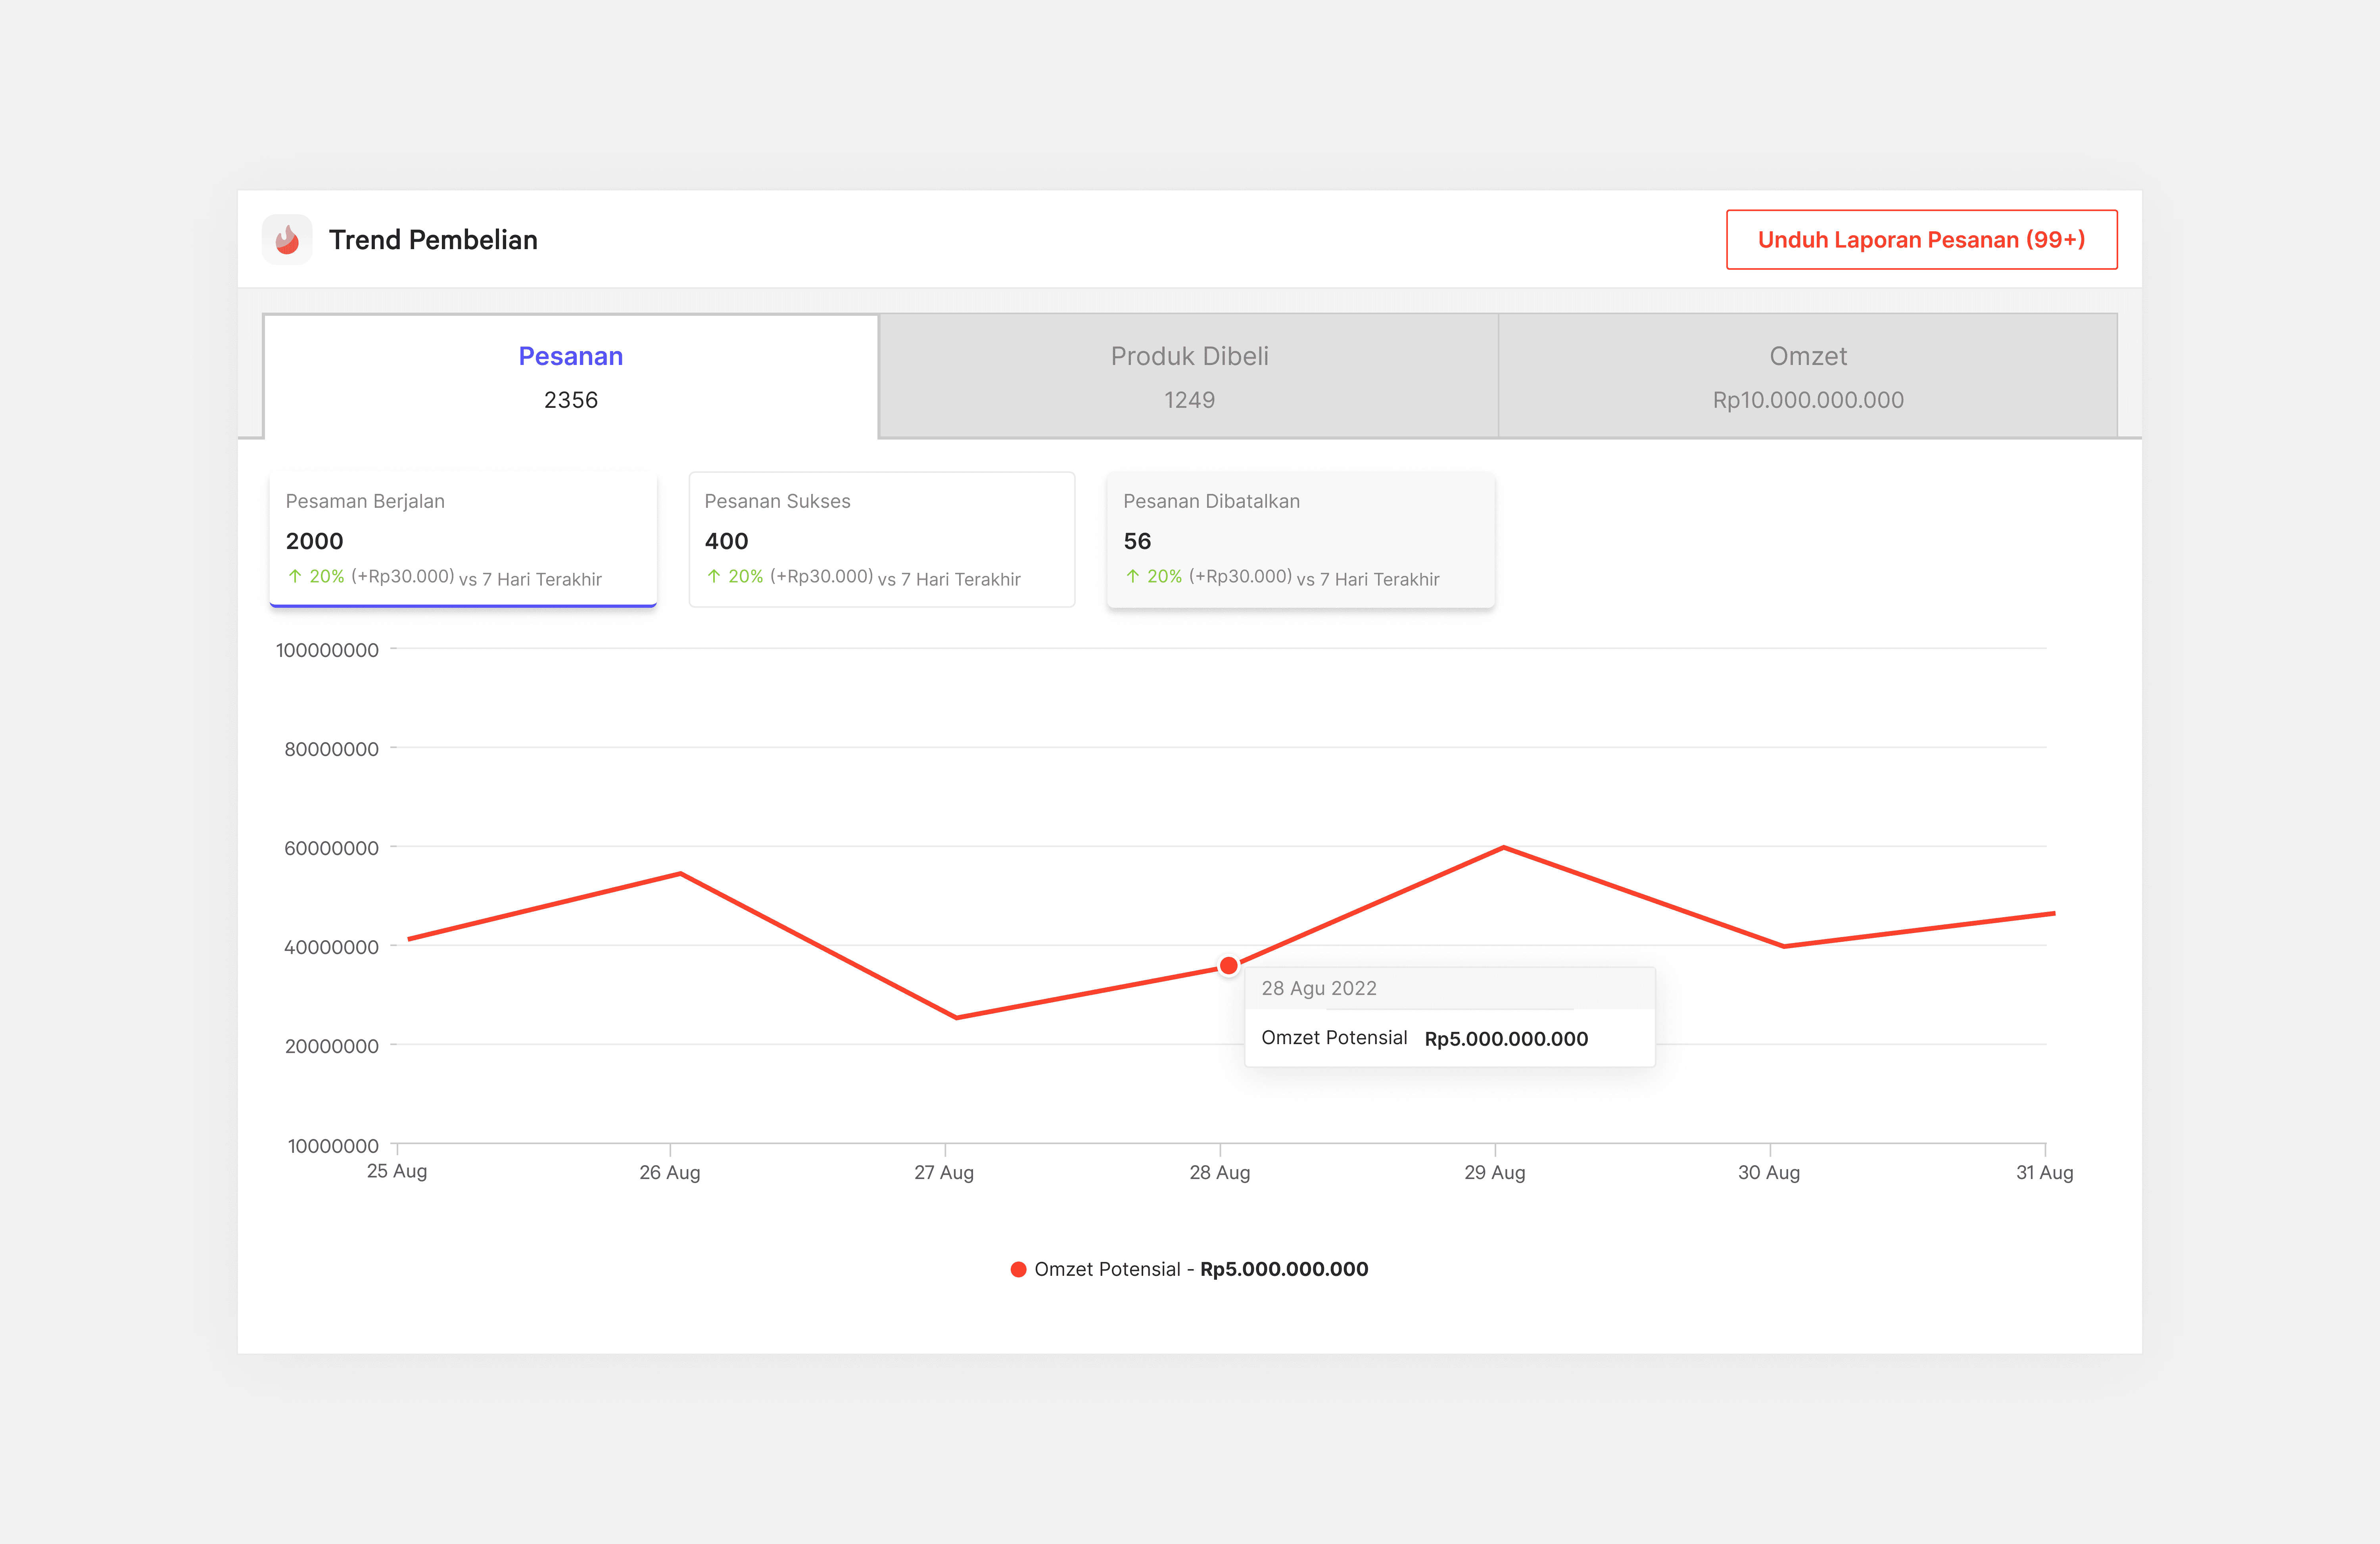
The order graph displays data on the number of orders generated through an affiliate's links as well as the revenue that will be generated from those orders and the commission earned by the affiliate for each order.. The data divided into 3 section; “Pesanan Berjalan”, “Pesanan Sukses”, and “Pesanan Dibatalkan”. Pesanan Berjalan is an ongoing order, Pesanan Sukses is a succeded order, and Pesanan dibatalkan is a canceled order.
Purchased Product (Produk Dibeli)
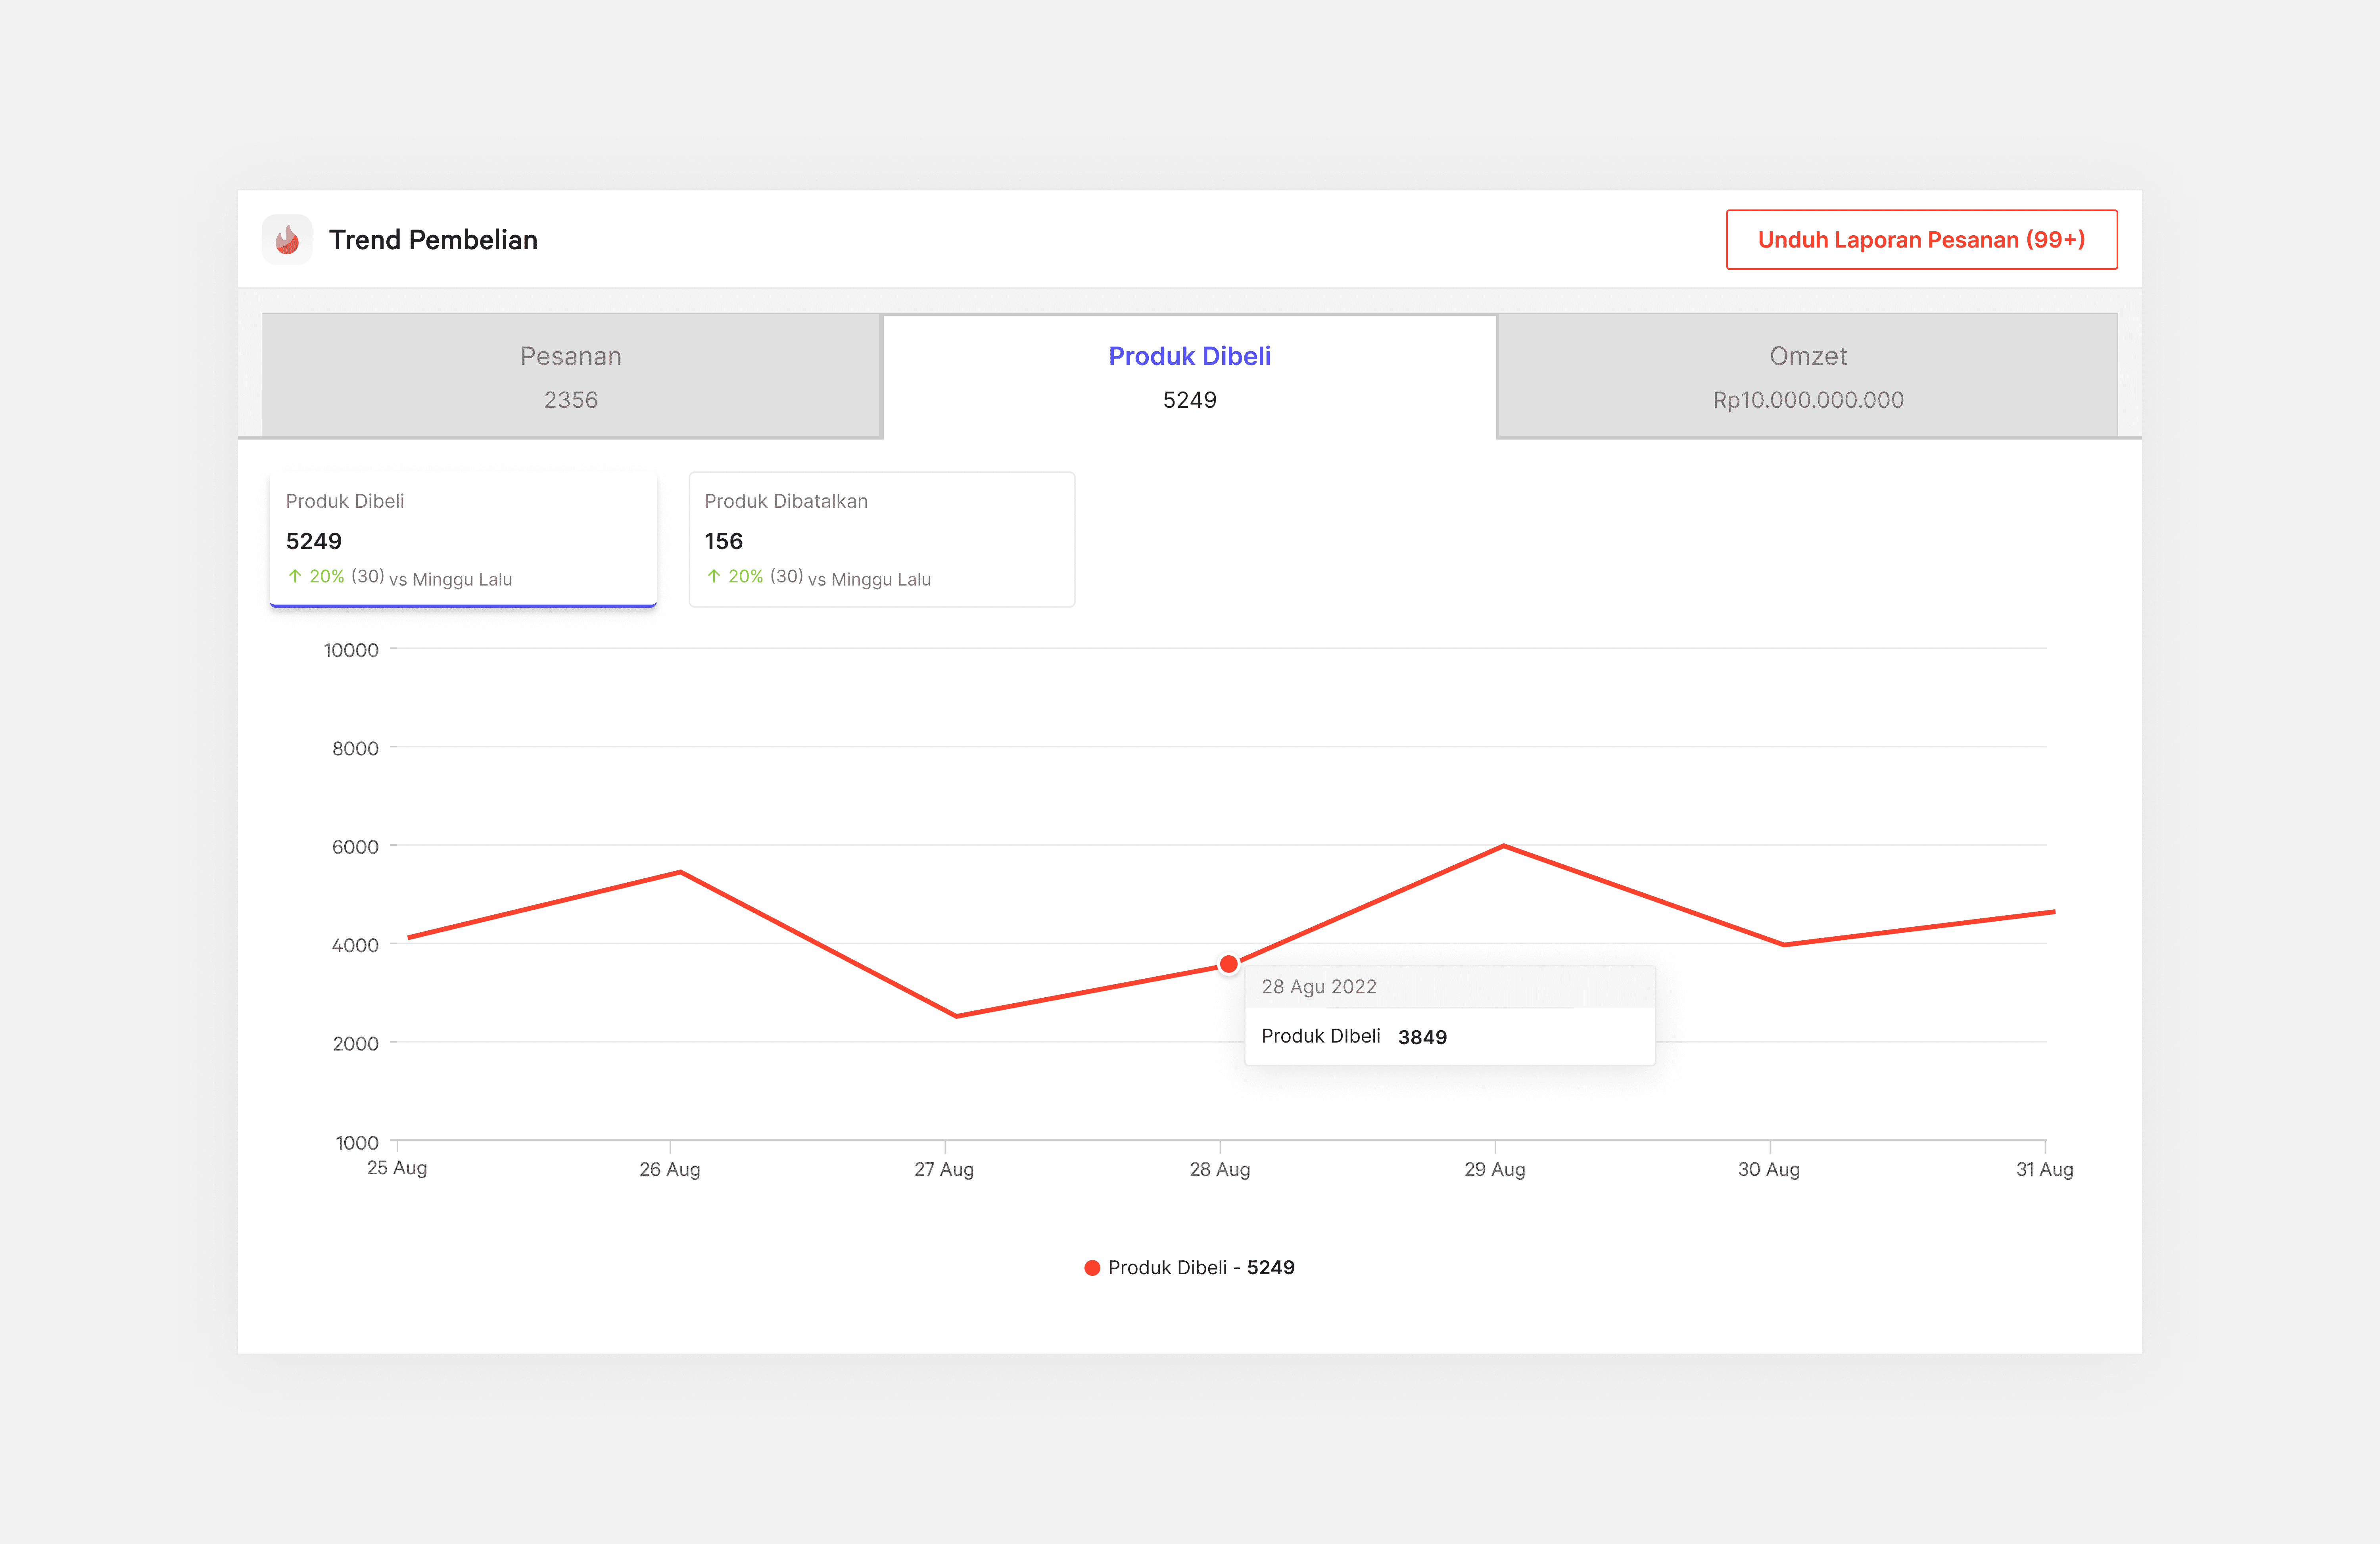
The order graph displays data on the number of orders generated through an affiliate's links as well as the revenue that will be generated from those orders and the commission earned by the affiliate for each order.. The data divided into 3 section; “Pesanan Berjalan”, “Pesanan Sukses”, and “Pesanan Dibatalkan”. Pesanan Berjalan is an ongoing order, Pesanan Sukses is a succeded order, and Pesanan dibatalkan is a canceled order.
Profit (Omzet)
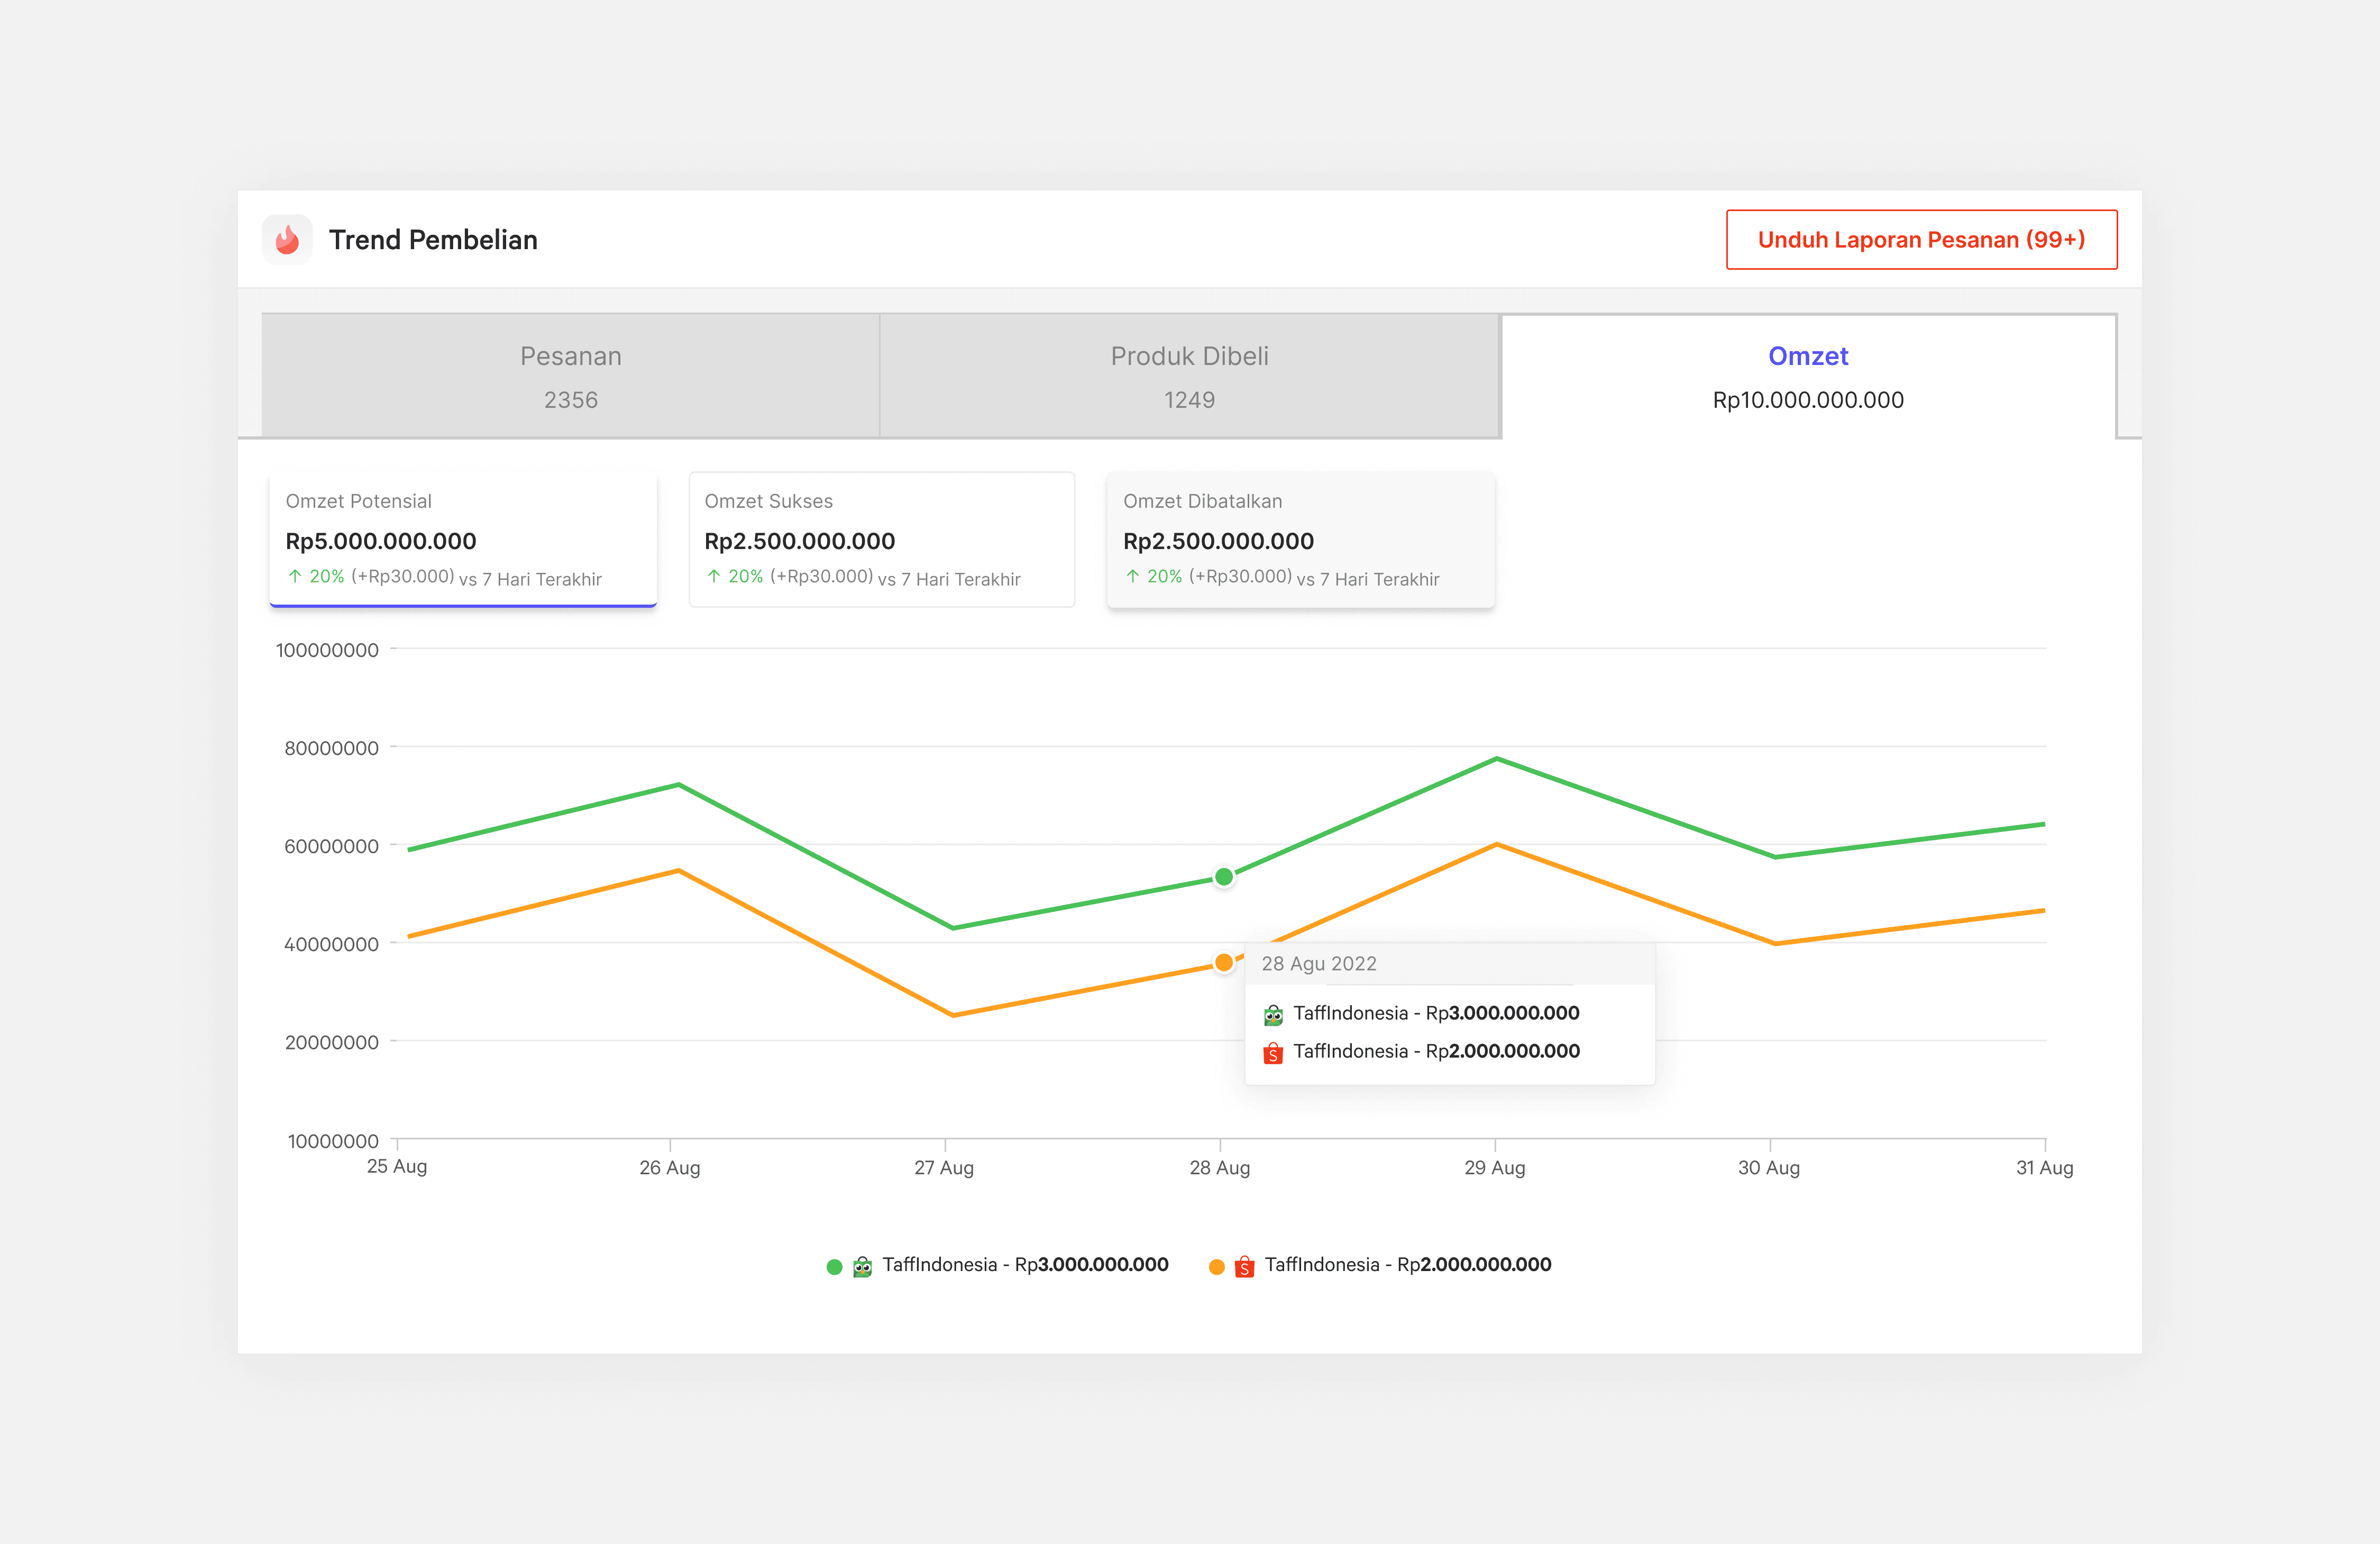
A revenue graph acts as a visualization tool used in affiliate marketing to track and analyze the revenue generated through an affiliate's links. The data divided into 3 main sections; “Omzet Potensial”, “Omzet Sukses”, and “Omzet Dibatalkan”